Happy Pride Month! 🏳️🌈
I recently spent a good deal of time diving into the garbage collector in my project EndlessClient. After making a change for resizing the game window dynamically and retooling the UI to be responsive, I noticed during debugging sessions that there were a boatload of GC events showing up. This was having a negative impact on performance as well as making it hard to spot actual issues in the performance analysis tools that run in Visual Studio by default. It was also impacting animation timings, which I was in the process of trying to tighten up so EndlessClient more properly emulated the original client.
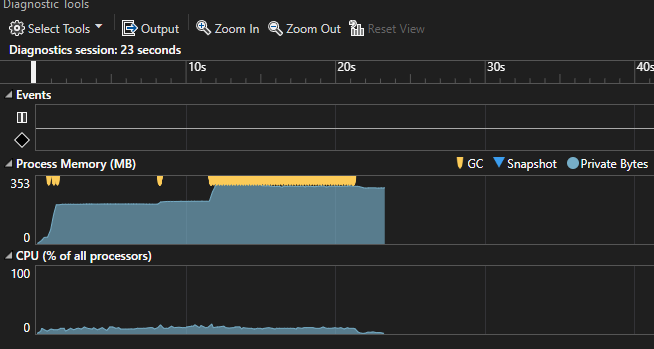
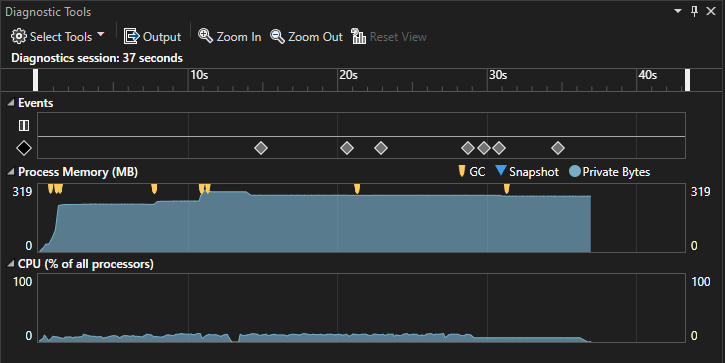
Here is an example of what my debugging sessions looked like:
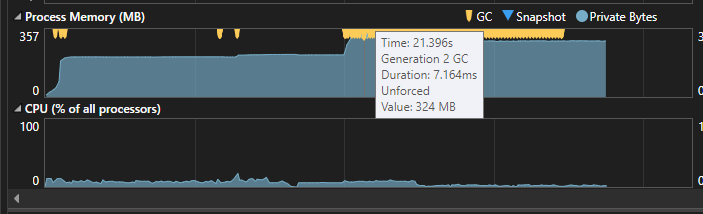
BIG oof. Every yellow marker is an individual garbage collection event, and there are hundreds of them in this short time span. For a game, especially one relying on immutable constructs such as EndlessClient, I’d expect to see GC events periodically but not nearly this frequently.
Immutable objects matter a lot here because of the sheer amount of garbage they generate. Most immutable patterns use With methods that return a new object with the updated specified property/value. Each time a new object is returned, the old object is discarded, which creates another unreferenced object that must be cleaned up.
Tuning the Garbage Collector
My first thought was “how do I keep the garbage collector from acting so aggressively”? This is the objectively wrong approach - it allows me to sidestep the actual cause of the problem, with the thought that “I’ll just create more memory pressure so GC doesn’t need to run as frequently”. However, it did give me the opportunity to learn a bit more about how the dotnet garbage collector works and some of the configuration options that are available.
Note that these options should almost never be tweaked.
All settings are documented here: https://learn.microsoft.com/en-us/dotnet/core/runtime-config/garbage-collector
Server vs Workstation GC profiles
dotnet has two garbage collection “modes” - server and workstation. The default out of the box is to run in “workstation” mode. Server mode is for high performance systems that are running as application backends, while workstation mode is for client-side applications that don’t have as much memory available.
Changing the mode was as simple as adding a json file to my project, and having it copy to the output directory. It was a bit unclear from documentation, but I needed to name this file EndlessClient.runtimeconfig.json. There are other options such as setting environment variables, but this felt like the easiest way to force GC settings changes when the dotnet runtime was launched for EndlessClient.
Here is the file:
{
   "runtimeOptions": {
      "configProperties": {
         "System.GC.Server": true
      }
   }
}
I attempted changing the mode from “Workstation” to “Server” in the above file, but there was no noticeable difference in debugging.
Per-object heap limits
Another notable implementation detail of the dotnet garbage collector is that objects are segregated into different heaps based on their properties. Any time you type new with a reference type, you are dynamically allocating memory, and the dotnet runtime assigns that memory to one of three heaps. These heaps are pretty straightforward, but it’s helpful to know that they exist:
- Large object heap: this is where large objects are sent. The definition of “large” is configurable.
- Small object heap: this is where small objects are sent. Based on the definition of “large” above.
- Pinned object heap: this is where pinned objects are sent. This is the smallest heap. A “pinned” object is one with a fixed location in memory, usually used in unsafe code.
The dotnet garbage collector has a good amount of flexibility for configuring these three different heaps. Here is an example runtimeconfig with some of these settings:
{
   "runtimeOptions": {
      "configProperties": {
         "System.GC.HeapHardLimitSOHPercent": 50,
         "System.GC.HeapHardLimitLOHPercent": 20,
         "System.GC.HeapHardLimitPOHPercent": 5,
      }
   }
}
There are restrictions to how these values are configured:
- They must be between ‘1’ and ‘100’
- The sum of all 3 must not be greater than 100
I figured (completely guessed) that there were a high number of GC events due to my use of immutable objects, the small object heap was being overloaded and causing this rush of GC events, so I attempted to increase the limits of the small object heap. This proved to have no impact on the number of events, but drastically increased memory usage.
Large object heap threshold
Remember how I said that the definition of large objects is configurable? This is the setting that determines which objects go on the small vs large heaps. The setting is LOHThreshold and determines the size in bytes for the cutoff of objects that get put on the large object heap.
{
   "runtimeOptions": {
      "configProperties": {
        "System.GC.LOHThreshold": 120000
      }
   }
}
My next complete guess was that one of the heaps was under a high amount of pressure due to the number of immutable objects being discarded. However, adjusting this value up/down did not yield any useful results.
Turning to profiling
I tried updating a few more settings, but wasn’t getting the results I wanted from memory usage or reduced number of GC events. Eventually, I turned to the GC profiler in Visual Studio, which I discovered while poking around the profiling settings.
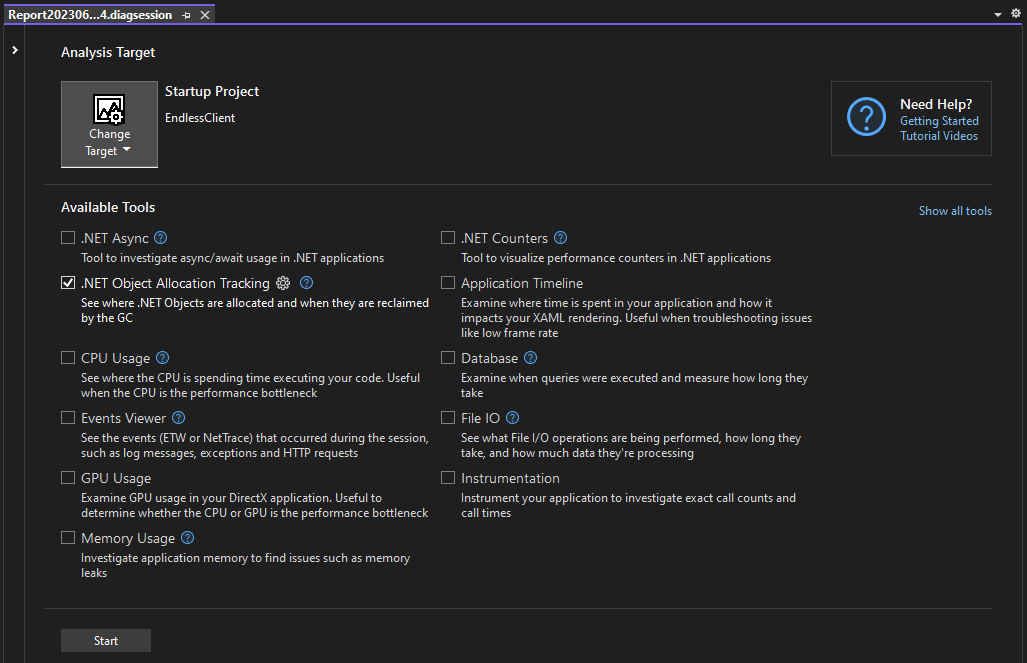
The .NET Object Allocation Tracking is exactly what I’m looking for, since I want to know where these allocations are coming from so I can find and fix them. I started a session, and selected the relevant time span for after the in-game transition had completed and the GC events were going out of control. Note that this took an astronomically long time to load given the amount of data it had to sift through.
Attempt one: reducing usage of anonymous lambdas
I learned something new about C# from this - when you capture a variable from outside of a lambda expression, that lambda must be later collected! Given my use of optional types in EndlessClient, I was using a lot of lambdas all over the place, with no regard to which variables I captured.
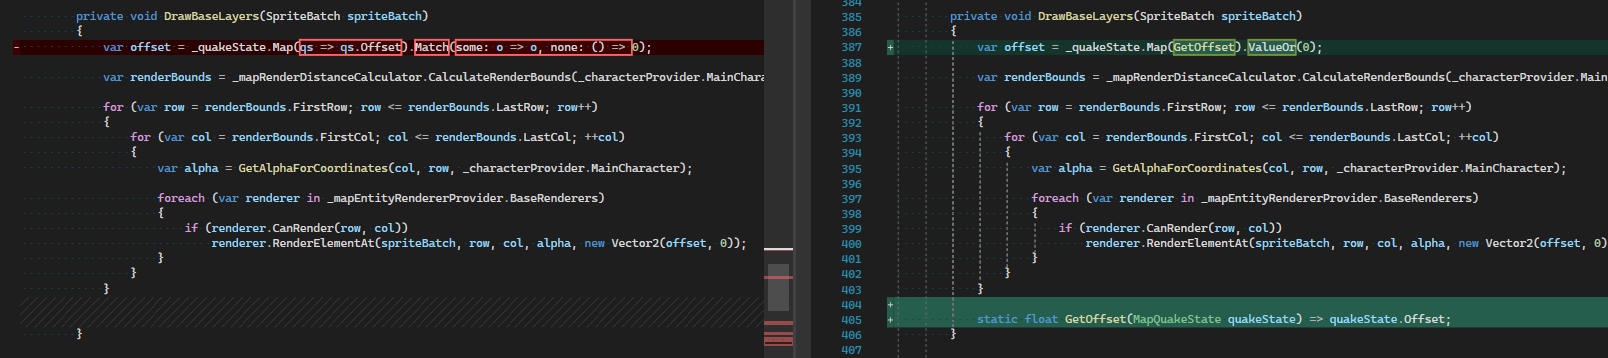
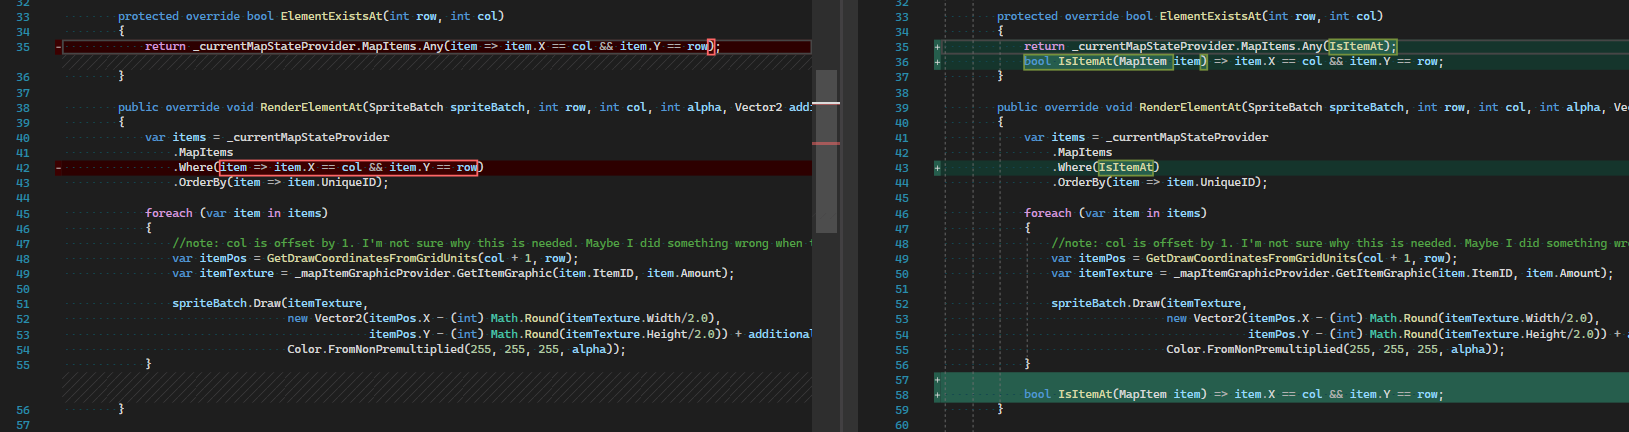
Looking purely at the number of allocations, this seemed like the greatest offender, so I went to work removing usage of lambdas in favor of local functions (which do not need to be garbage collected). An example of one such change is listed below:
The results were disappointing, but I figured I’d keep trekking on by fixing the next highest usages in future profiling sessions until my GC events returned to normal.
Attempt two: reducing even more lambdas
The next couple iterations of attempts revolved around reducing lambdas in two hot areas: map entity renderers, and GFX 1 resource loading. The debugging process was exactly the same as above - profile the application, find a high number of allocations, attempt to resolve, and repeat.
Map entity renderer changes were something like this:
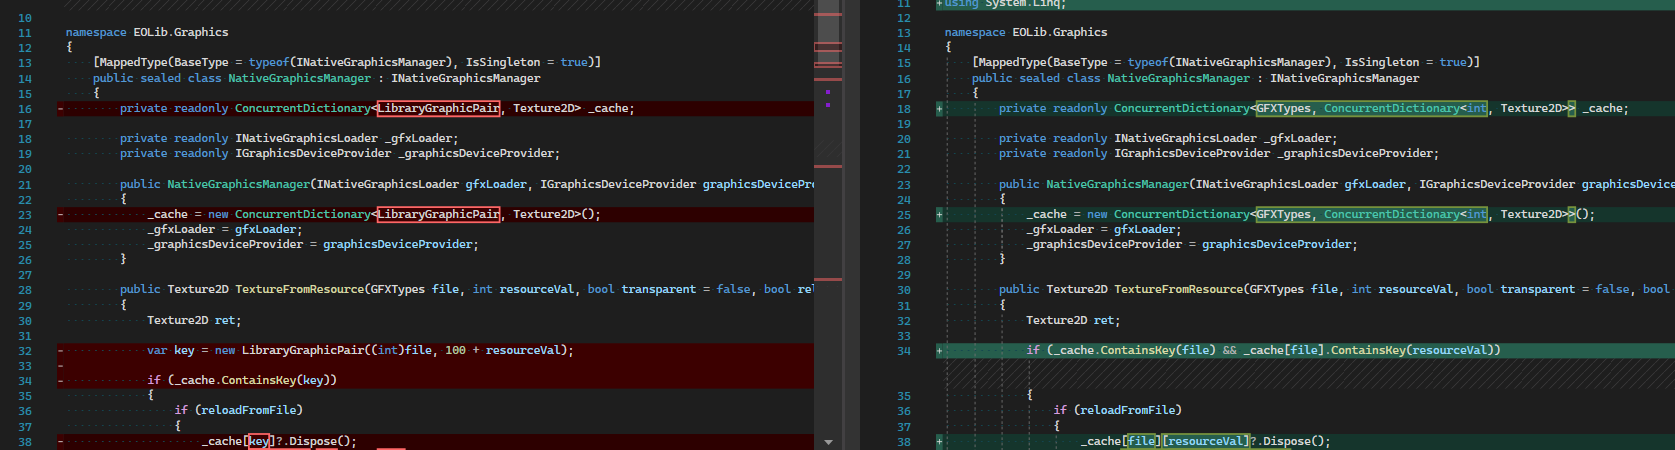
GFX loading was a bit more involved. I created a custom type LibraryGraphicPair way back in the dawn of EndlessClient. Instead of relying on creating a new LibraryGraphicPair object for each GFX lookup, I decided to use a dictionary of dictionaries in NativeGraphicsManager, which is the core class that handles all loading of GFX. Every time a bitmap is shown on screen, it has gone through NativeGraphicsManager, so ensuring this component is high performance is critical.
The results were less than exciting. The problem is still not resolved, and I’ve only scratched the surface of analyzing high allocation areas.
Attempt three: reducing copies in GFX loading
Next, I went down a rabbit-hole optimizing PELoaderLib. Referring back to the original profile I ran, I noticed a high number of copies of objects in the “hot path” of GFX loading. I want to dive into this more in-depth in a separate blog post, because the solution deserves more attention, but I’ll give a quick overview here.
The original method for loading graphics was as follows:
- Allocate image data byte array, copy data from memory-mapped file to byte array
- Allocate byte array with bitmap header, copy data from image data byte array to full data array with header
- Use SixLabors.ImageSharp to load full byte array into
IImagerepresentation - If
transparentflag is set, apply a recolor brush to make black pixels transparent - Copy image data from recolored
IImageto MonogameTexture2D
This process is one that I’m not particularly fond of. There are so many image copies taking place, and each copy orphans an array that needs to be garbage collected later.
Eventually, I updated PELoaderLib with the following process. It involved using a random-access memory-mapped view instead of a sequential access view, which is what I was already doing when parsing the PE files anyway.
- Get
Span<byte>represented by a pointer (!!!) to the start of the image data and the data length - Allocate byte array with bitmap header, copy data from
Span<byte>of image data to new array and return asMemory<byte> - Convert
Memory<byte>to stream and pass it toTexture2D.FromStream
Transparent recoloring is handled during data import thanks to an API update by Monogame 3.8.1, but now there are really only two data copies instead of the four from the previous method. Additionally, the amount of garbage generated by this process is significantly reduced.
This turned out not to have a significant impact on performance or reduce the number of garbage collections.
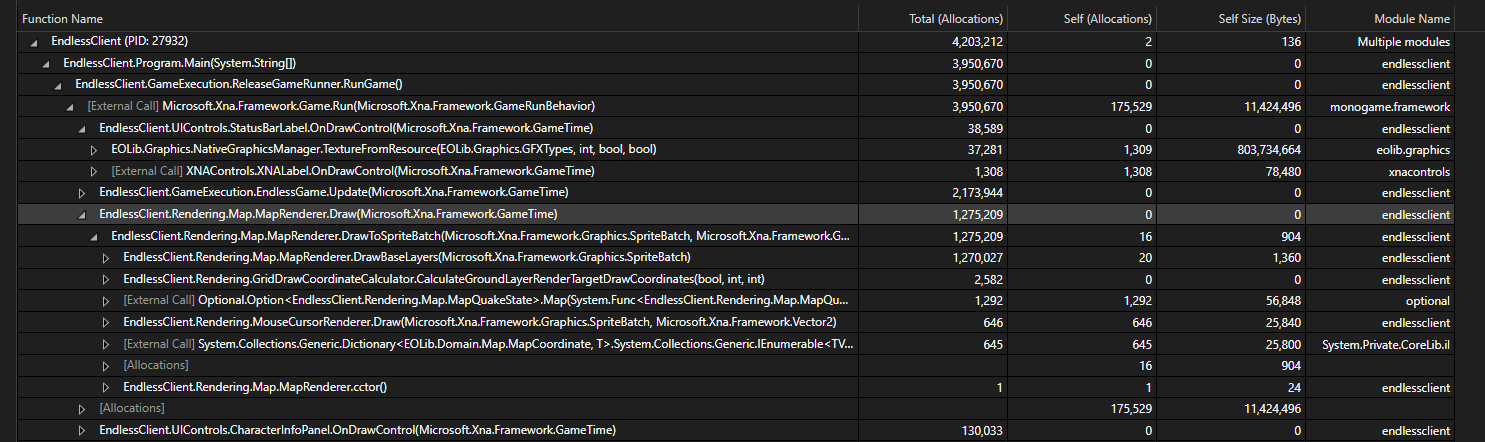
Final attempt: reading the right column
You may have noticed in my original data capture that I was only looking at allocations. If you look two columns to the right, there is a serious offender in the “Self Size (bytes)” column. This column is in a now-familiar area of code: NativeGraphicsManager. We’ve spent quite a bit of time in this area, so I’m ready to move on, but I notice something interesting looking one line up.
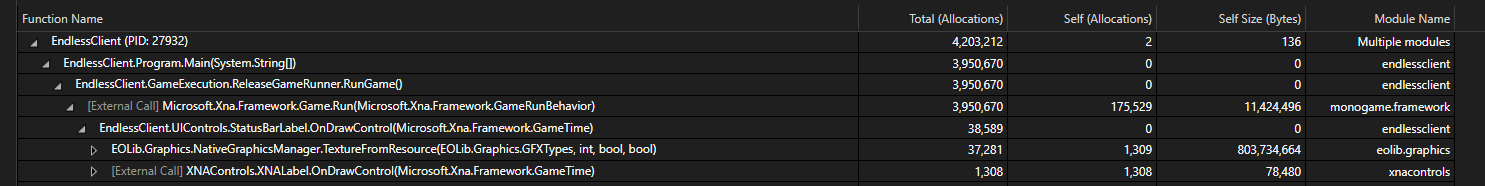
There is, in the call tree, a specific call coming from StatusBarLabel.OnDrawControl. That’s interesting - I’ve been focused on NativeGraphicsManager as a whole, but never the specific calls to it.
Looking at that class, OnDrawControl calls TextureFromResource like so:
protected override void OnDrawControl(GameTime gameTime)
{
    if (_clientWindowSizeProvider.Resizable)
    {
        var hudBackground = _nativeGraphicsManager.TextureFromResource(GFXTypes.PostLoginUI, 1, false, true);
        var bgDrawArea = new Rectangle(0, _clientWindowSizeProvider.Height - 20, _clientWindowSizeProvider.Width, 20);

        _spriteBatch.Begin(samplerState: SamplerState.LinearWrap);
        _spriteBatch.Draw(hudBackground, bgDrawArea, _background, Color.White);
        _spriteBatch.End();

        _spriteBatch.Begin();
        _spriteBatch.Draw(hudBackground, bgDrawArea.Location.ToVector2(), _leftSide, Color.White);
        _spriteBatch.Draw(hudBackground, new Vector2(_clientWindowSizeProvider.Width - _rightSide.Width, bgDrawArea.Y), _rightSide, Color.White);
        _spriteBatch.End();
    }

    base.OnDrawControl(gameTime);
}
The important thing to note here is the fourth parameter. Going to the signature of TextureFromResource:
Texture2D TextureFromResource(GFXTypes file, int resourceVal, bool transparent = false, bool reloadFromFile = false);
NOW we’re cooking with gas. I’m reloading a texture from file every time draw is called. The original reason for this is that texture PostLoginUI:1 is loaded previously with transparent: true, and I wanted it to be forced as non-transparent for resizable display mode.
This is normally fine, but doing it in the draw loop is a Very Bad Thing™. Let’s try making the change to load the texture as non-transparent a single time.
Much better. This is what I wanted to see - one GC event every ten seconds, rather than dozens every second.
Wrapping up
At this point, I had removed the primary cause of my GC woes, and was able to move on to further improving animation timings.
One additional GC issue came up when mousing over NPCs. The problem was that I was calling Texture2D.GetData in the update loop to determine if a pixel was opaque or not. Instead, I ended up caching NPC texture data when the NPC is first loaded so GetData only needs to be called for a given texture a single time. This also deserves its own blog post, so I’ll go into more detail in the future.
GFX refers to PE resource bitmap files used for game assets ↩︎